- Home
- General Info
- Solutions
- Overview of Cheque Clearing and Processing
- Cheque Truncation System (CTS)
- Cheque Fraud Solution
- Cheque Book Issuing Systems
- Cheque Entry Solutions
- Cheque Encoding Solutions
- Outward Clearing Solution
- Automated Cheque Settlement
- Inward Clearing Solutions
- Cheque Archival Solutions
- Teller Cheque Deposit Solution
- Products
- Support
- Company
MICR Character Tolerances and Waveforms
MICR Character Tolerances and Waveforms
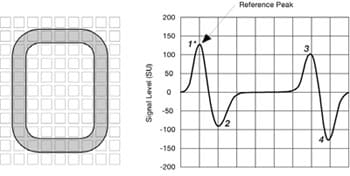
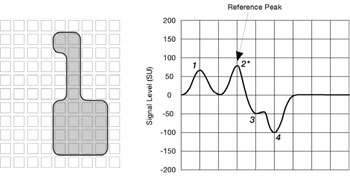
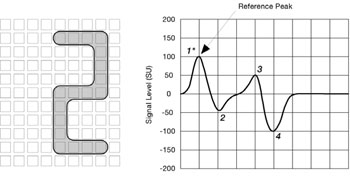
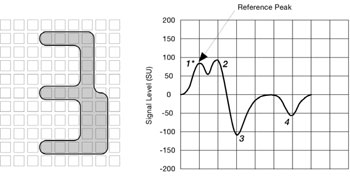
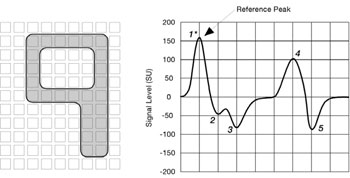
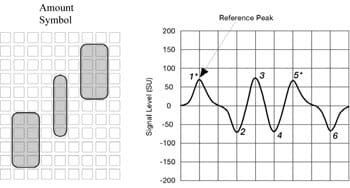
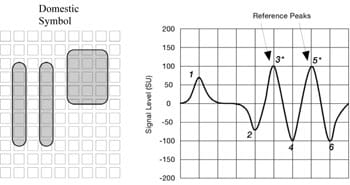
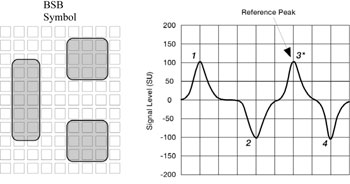
This Appendix shows the ideal shape each of the MICR numbers and symbols outlined against the 0.010 inch grid. The straight edges of each character should ideally run midway down the 0.003 inch space between the squares. The allowed tolerance is the edge of the adjacent square.
Illustrated next to the character outline is the nominal theoretical waveform for that character, with the peak(s) used for measurement of signal strength noted. All relate to the reference peak for the Domestic symbol that is rated at 100.
These waveforms are mathematically derived from a theoretical model based on the design of the MICR tester defined in ANSI X9-27 and ideal MICR characters. These characters have perfect edges and dimensions, completely uniform ink cover and the magnetisation is parallel to the plane of the paper. These waveforms are not specified as standards because commercially available test equipment and printed MICR documents cannot conform exactly to the model. These is however sufficiently good correlation between the model and actual waveforms for them to be a very useful tool in examining the quality of MICR.
The signal strength derived from the reference peaks is definitely defined as a standard and is shown in the table below together with the high and low tolerance levels at 75% to 200% of the nominal. Printed documents must conform to these tolerance limits.
| MICR Character | Reference Peak | Minimum Signal Level (75%) | Nominal Signal Level | Maximum Signal Level (200%) |
| 0 | 1 | 98 | 130 | 260 |
| 1 | 1 | 64 | 85 | 170 |
| 2 | 2 | 79 | 105 | 210 |
| 3 | 1 | 64 | 85 | 170 |
| 4 | 1 | 79 | 105 | 210 |
| 5 | 3 | 79 | 105 | 210 |
| 6 | 1 | 79 | 105 | 210 |
| 7 | 5 | 56 | 75 | 150 |
| 8 | 1 | 79 | 105 | 210 |
| 9 | 4 | 113 | 165 | 330 |
| B” | 1 & 5 (average) | 53 | 70 | 140 |
| C | 3 & 5 (average) | 75 | 100 | 200 |
| A | 3 | 79 | 105 | 210 |
| > | 3 & 5 (average) | 50 | 67 | 134 |
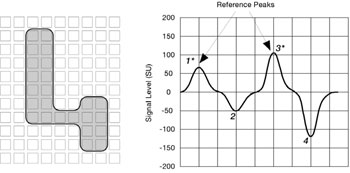
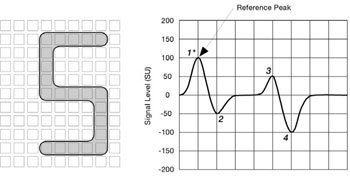
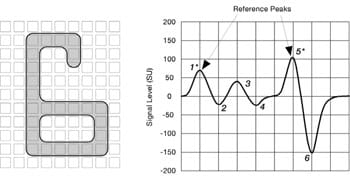
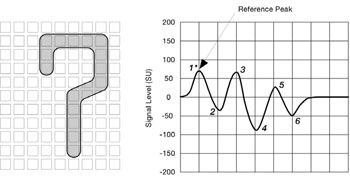

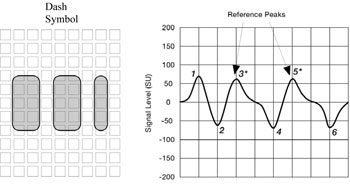
Source: Design Specifications for Cheques – APCA (Australian Payments Clearing Association)